
How I Generated 17 Tracked Conversions for a UK Electrician in August 2025
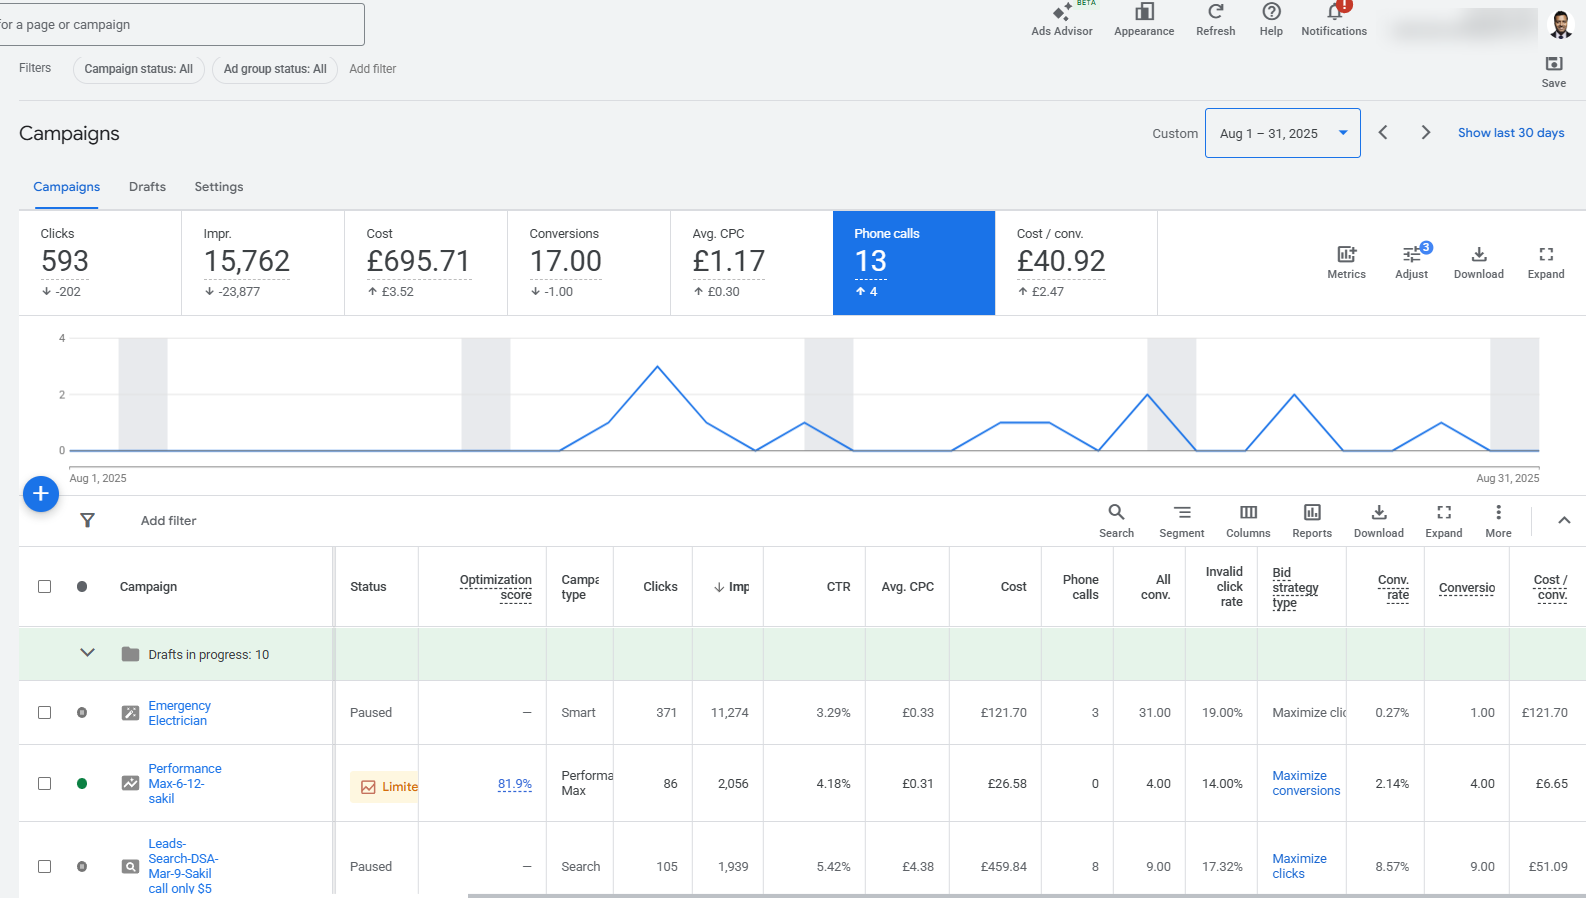
Monthly Results at a Glance
17
£40.92
13
593
15,762
£695.71
Monthly Context
Monthly results can change with demand, campaign mix, budgets and competition, so I present the figures as a transparent performance snapshot rather than a guarantee of future results.
What the Monthly Data Shows
Tracked conversion activity
The account recorded 17 tracked conversions during August 2025.
Phone-call activity
Google Ads recorded 13 phone calls during the month.
Cost efficiency
Total spend was £695.71, with an average cost per conversion of £40.92 and an average CPC of £1.17.
Click volume
The ads generated 593 clicks from people interacting with the campaigns.
Search visibility
The campaigns received 15,762 impressions, with an approximate click-through rate of 3.76%.
Reporting note
The calculated conversion rate was approximately 2.87%. “Tracked conversions” means recorded Google Ads actions; the screenshot alone does not prove that every action became a qualified lead or paying customer.
The Results
The average cost per conversion was £40.92, the average cost per click was £1.17, and the calculated conversion rate was approximately 2.87%.
I use “tracked conversions” because the screenshot confirms recorded actions; it does not by itself confirm that every action became a qualified lead or paying customer.
What August’s Performance Shows
- Monthly outcome: August recorded 17 tracked conversions and 13 phone calls.
- Direct-contact concentration: most recorded conversions involved a phone call.
- Acquisition cost: £695.71 in spend produced a £40.92 average cost per conversion.
- Early optimisation benchmark: this was one of the higher-cost months in the supplied series.
August demonstrates that the campaign was producing direct enquiries, but not yet at the later account’s level of cost efficiency. It is best used as an early benchmark against the lower costs achieved from autumn onward.