
How I Generated 65 Tracked Conversions for a UK Electrician in February 2026
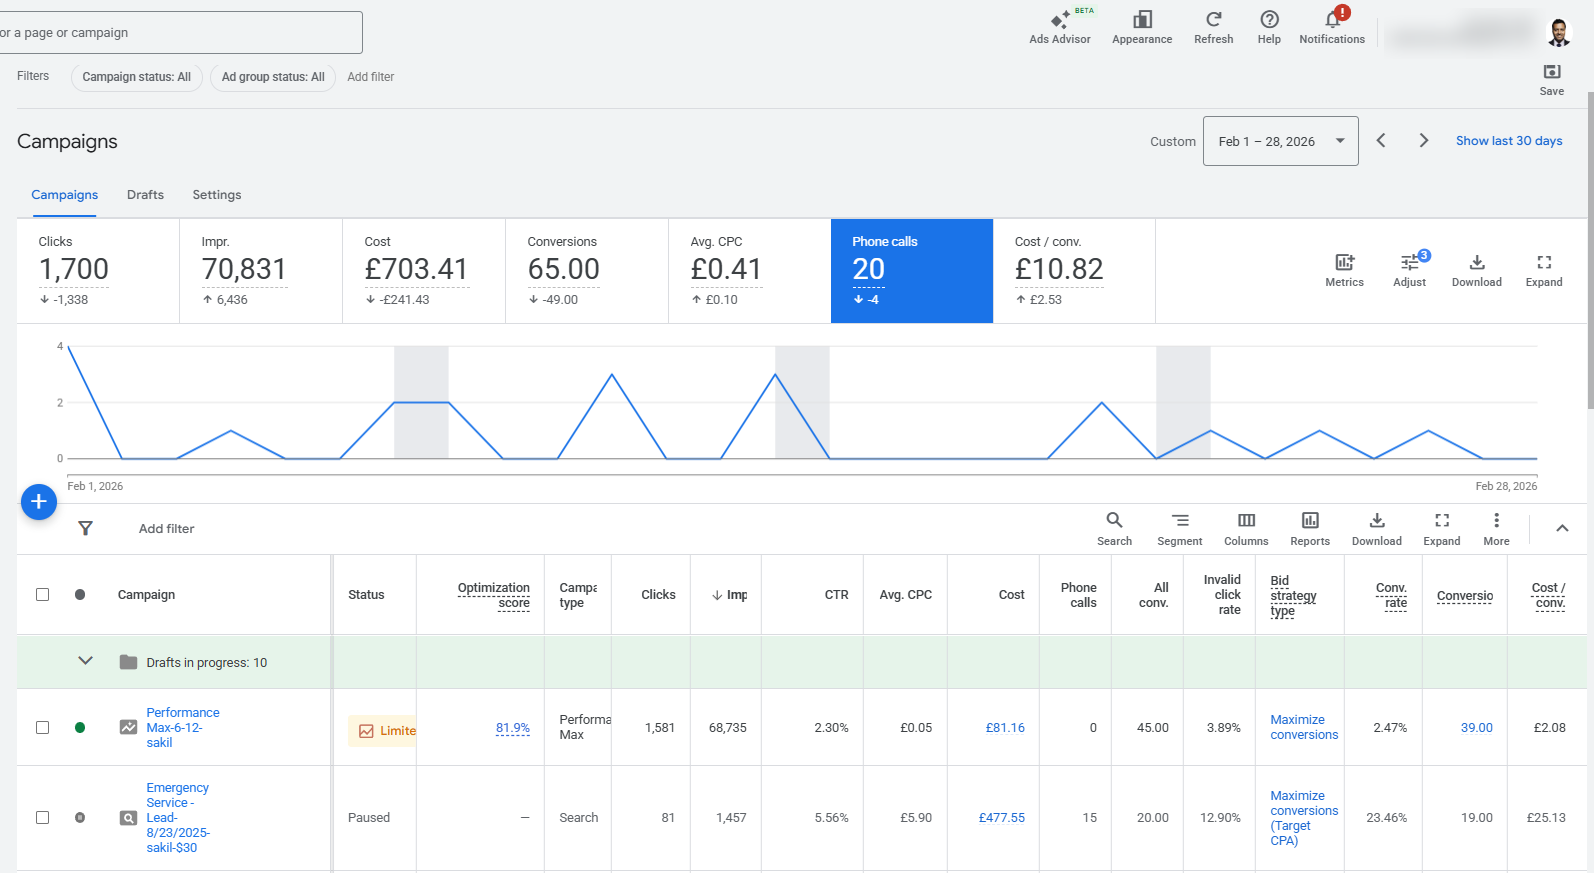
Monthly Results at a Glance
65
£10.82
20
1,700
70,831
£703.41
Monthly Context
Monthly results can change with demand, campaign mix, budgets and competition, so I present the figures as a transparent performance snapshot rather than a guarantee of future results.
What the Monthly Data Shows
Tracked conversion activity
The account recorded 65 tracked conversions during February 2026.
Phone-call activity
Google Ads recorded 20 phone calls during the month.
Cost efficiency
Total spend was £703.41, with an average cost per conversion of £10.82 and an average CPC of £0.41.
Click volume
The ads generated 1,700 clicks from people interacting with the campaigns.
Search visibility
The campaigns received 70,831 impressions, with an approximate click-through rate of 2.40%.
Reporting note
The calculated conversion rate was approximately 3.82%. “Tracked conversions” means recorded Google Ads actions; the screenshot alone does not prove that every action became a qualified lead or paying customer.
The Results
The average cost per conversion was £10.82, the average cost per click was £0.41, and the calculated conversion rate was approximately 3.82%.
I use “tracked conversions” because the screenshot confirms recorded actions; it does not by itself confirm that every action became a qualified lead or paying customer.
What February’s Performance Shows
- Lead activity: 65 tracked conversions included 20 phone calls during February 2026.
- Cost efficiency: £703.41 in spend produced an average cost per conversion of £10.82.
- Efficient traffic cost: 1,700 clicks were generated at an average CPC of £0.41.
- Channel mix matters: phone calls were reported separately, so total conversions should not be described as calls alone.
February delivered measurable conversion volume at a low reported acquisition cost. Call recordings or CRM outcomes are still needed to determine how many actions became qualified electrical jobs.